The Engulfing Candle is one of the simplest and possibly most underrated chart patterns in trading.
In this tutorial, I'll show you how to identify the pattern, what it tells us as traders and I'll give you some trading strategies that use this pattern.
Many people over-complicate this pattern, but it's very simple.
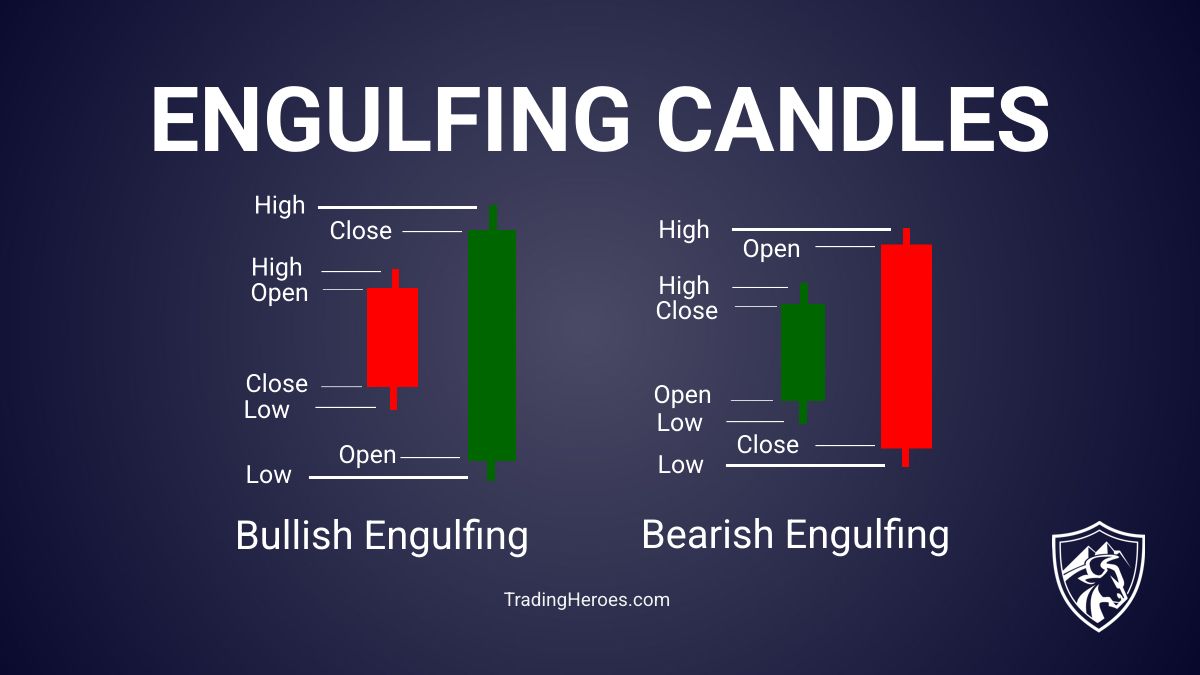
There are basically 2 types of Engulfing Candles.
Here's how to identify them.
Bullish Engulfing Candle
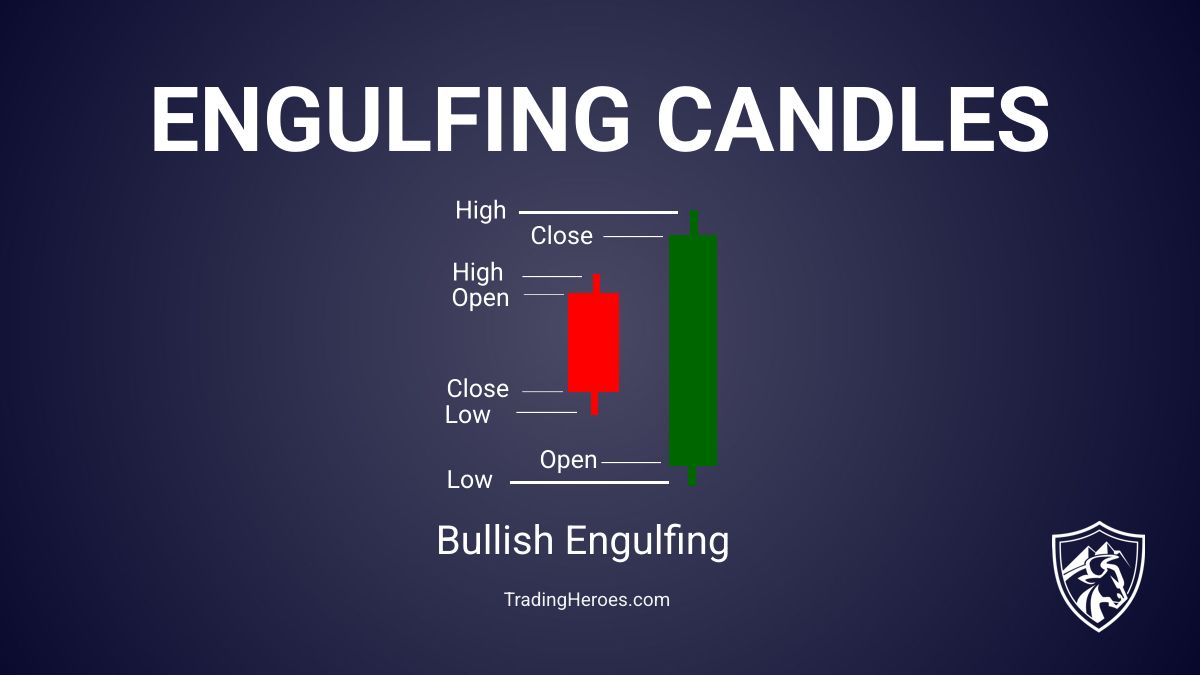
A Bullish Engulfing candlestick pattern signals a potential reversal from a downtrend to an uptrend.
Here's what to look for:
- 2-candle formation
- First candle is smaller than the second candle and the close is lower than the open
- Second candle has the largest candle body that has been seen in awhile and the close is higher than the open
- The high of the second candle is higher than the high of the first candle
- The low of the second candle is lower than the low of the first candle
- The second candle closes near the high of its range
- This pattern has to print on a support or resistance level
Examples
Here is an example of a Bullish Engulfing pattern on a Bitcoin chart. The blue arrow shows the Engulfing Candle.

Notice how this was a dramatic turning point on the chart.
This obviously won't happen all the time, but it does happen frequently enough that you should pay attention.
Here's a second example on the USDCHF Forex pair.
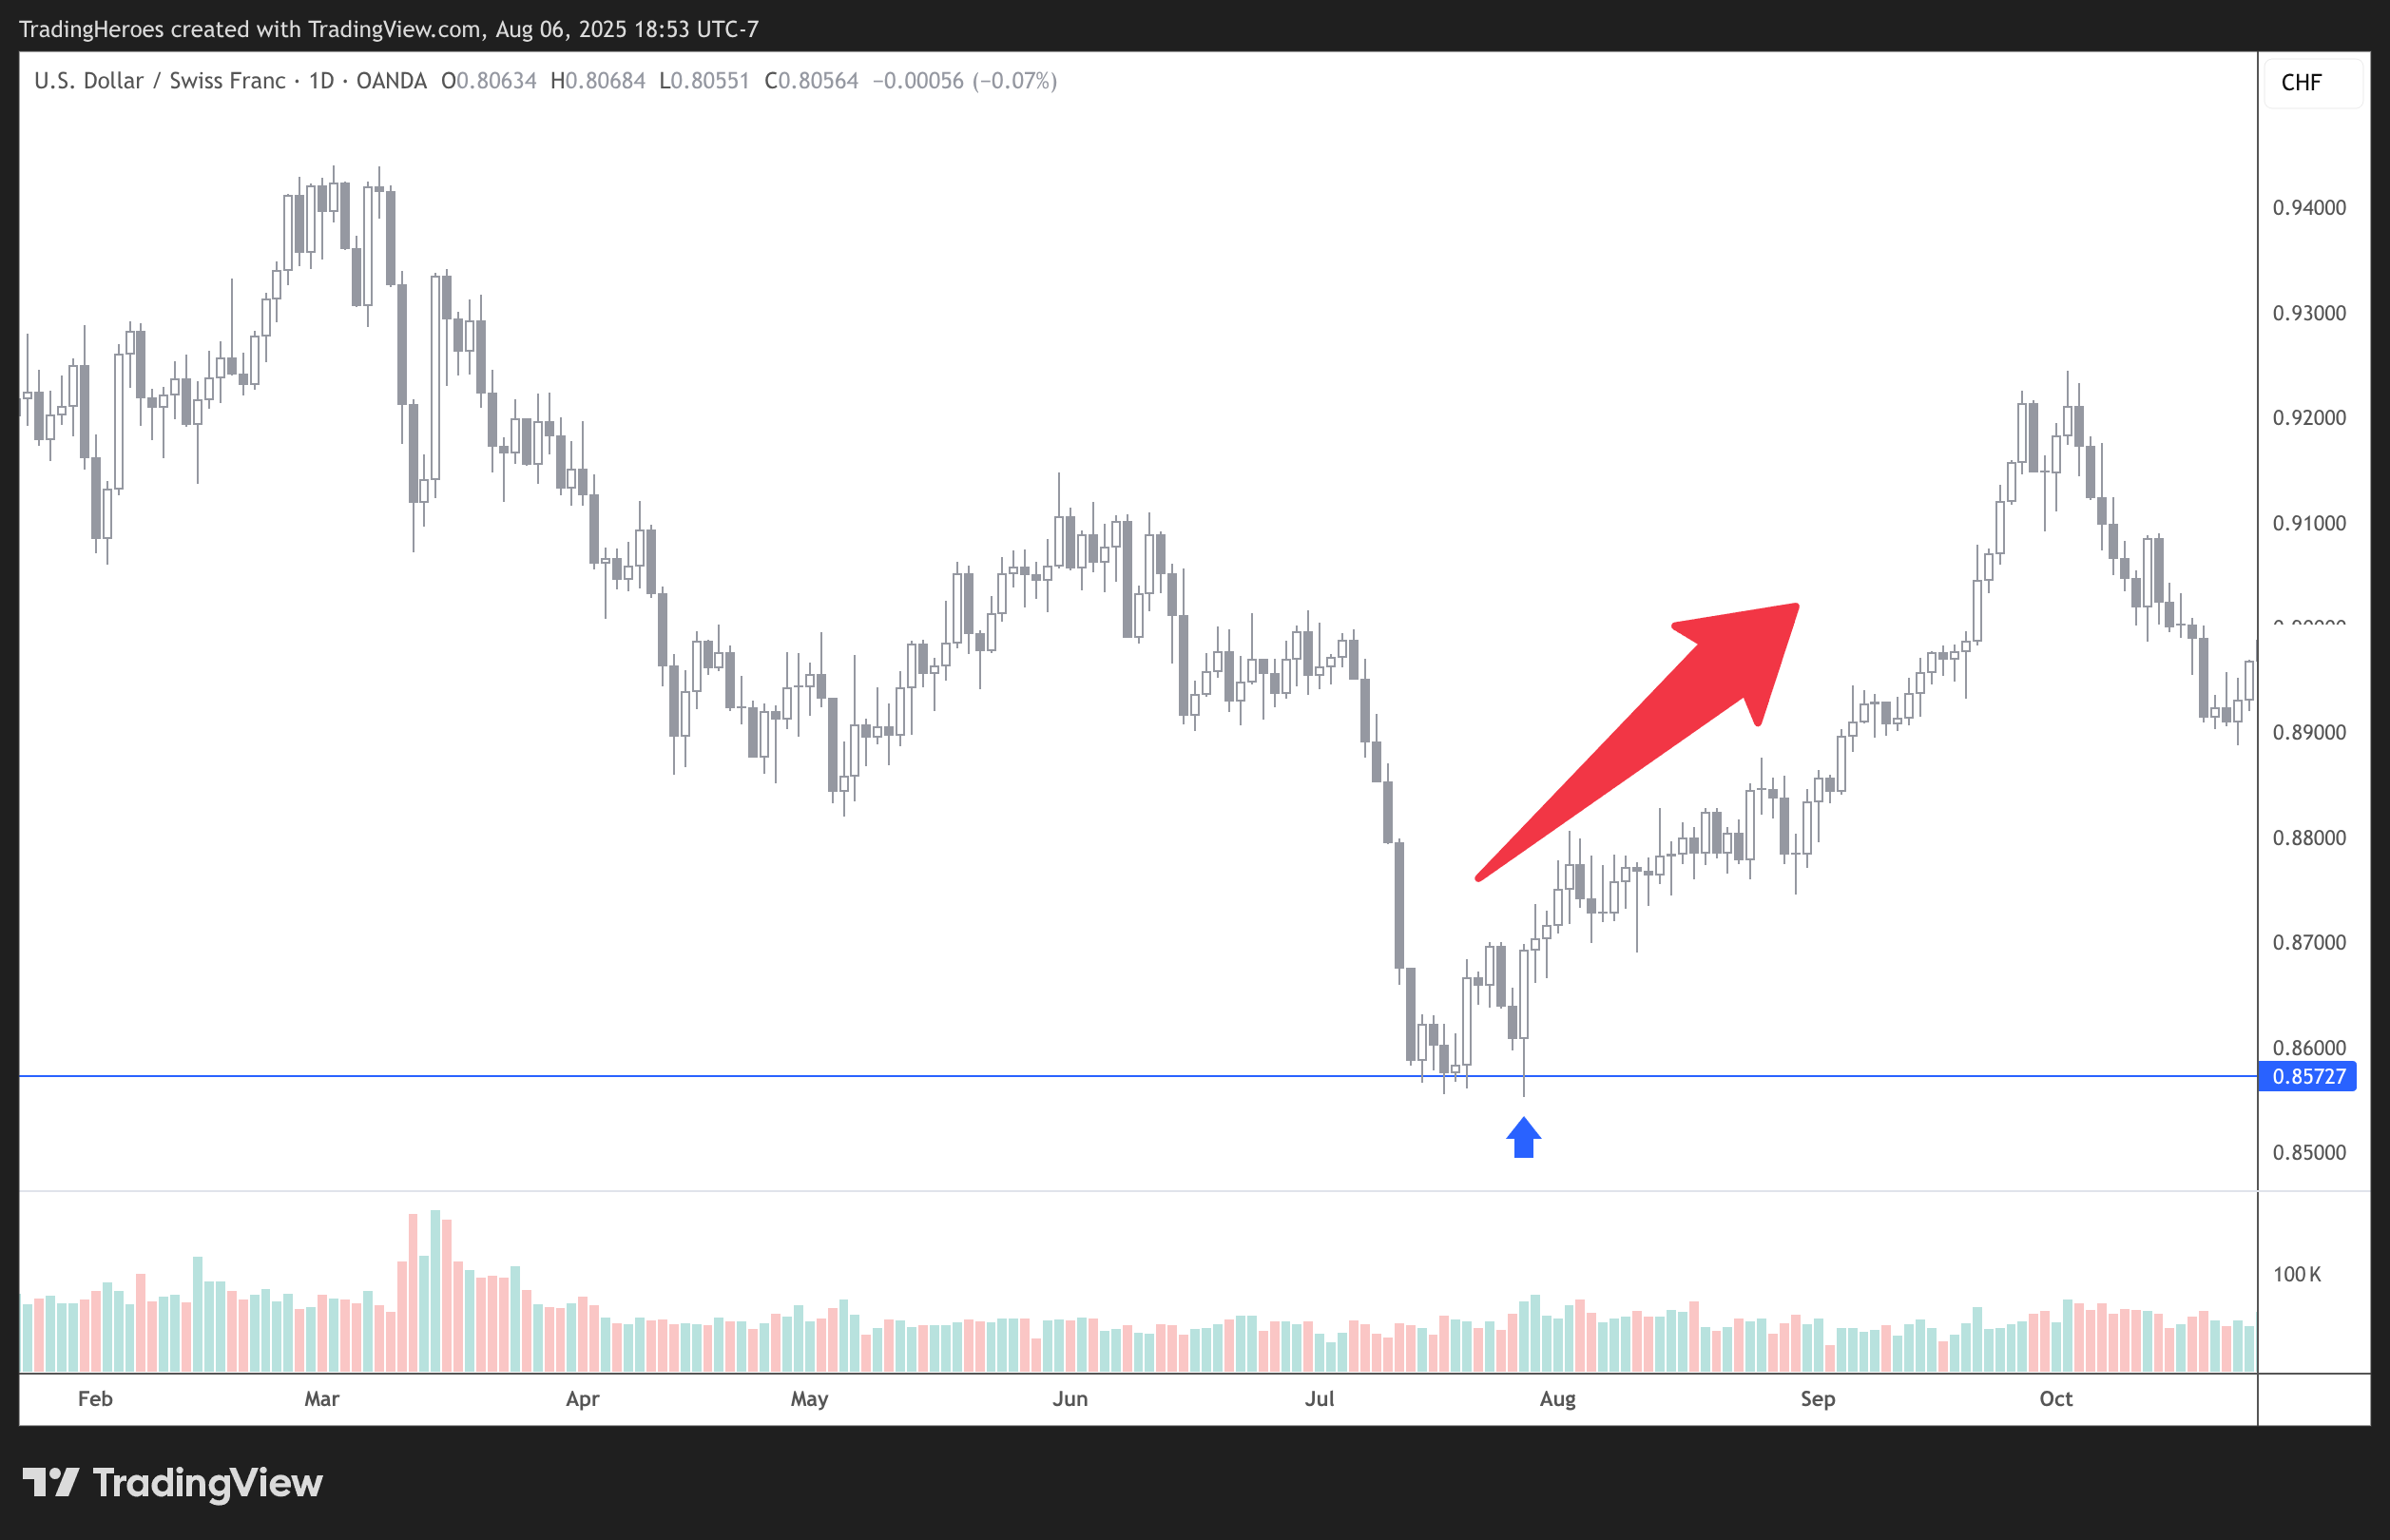
This one rallied hard after the pattern printed on a previous support level.
So those are just a couple of examples of when a Bullish Engulfing Candle can signal an upward move in a market.
Now let's take a look at the opposite of this pattern.
Bearish Engulfing Candle
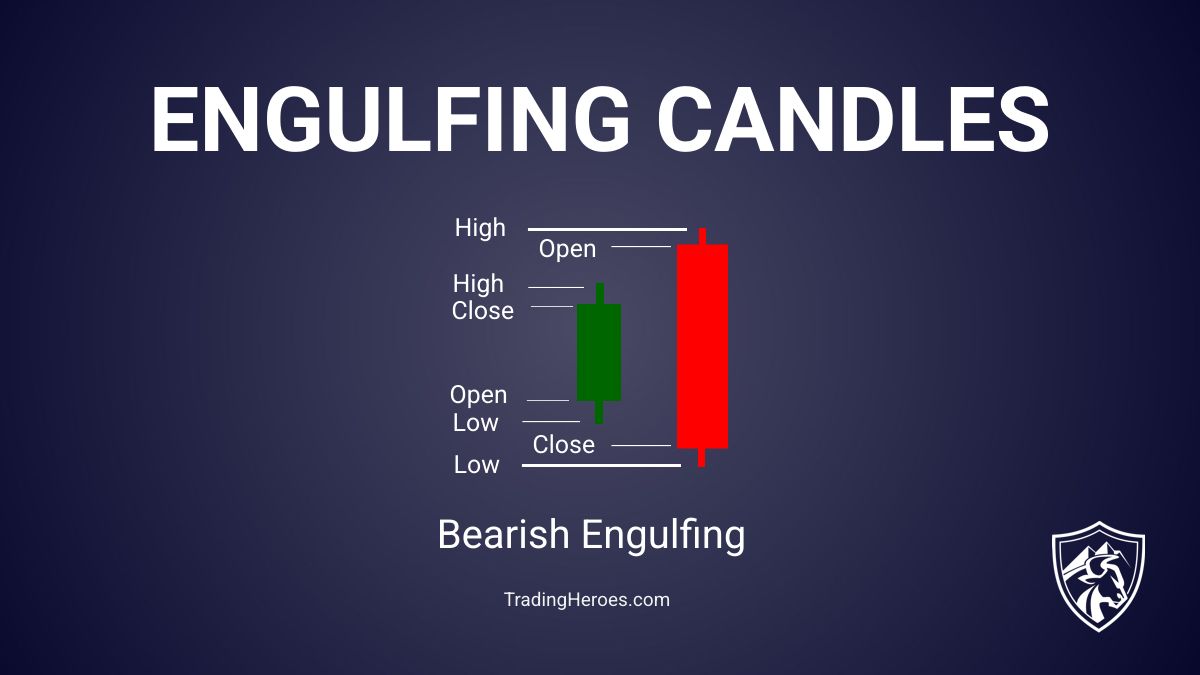
A Bearish Engulfing candlestick pattern signals a potential reversal from a downtrend to an uptrend.
Here's what to look for:
- 2-candle formation
- First candle is smaller than the second candle and the close is higher than the open
- Second candle has the largest candle body that has been seen in awhile and the close is lower than the open
- The high of the second candle is higher than the high of the first candle
- The low of the second candle is lower than the low of the first candle
- The second candle closes near the low of its range
- This pattern has to print on a support or resistance level
Examples
This example on the AUDNZD chart shows how fast price can move after a Bearish Engulfing candle pattern.
Notice how it prints on a previous level of resistance.

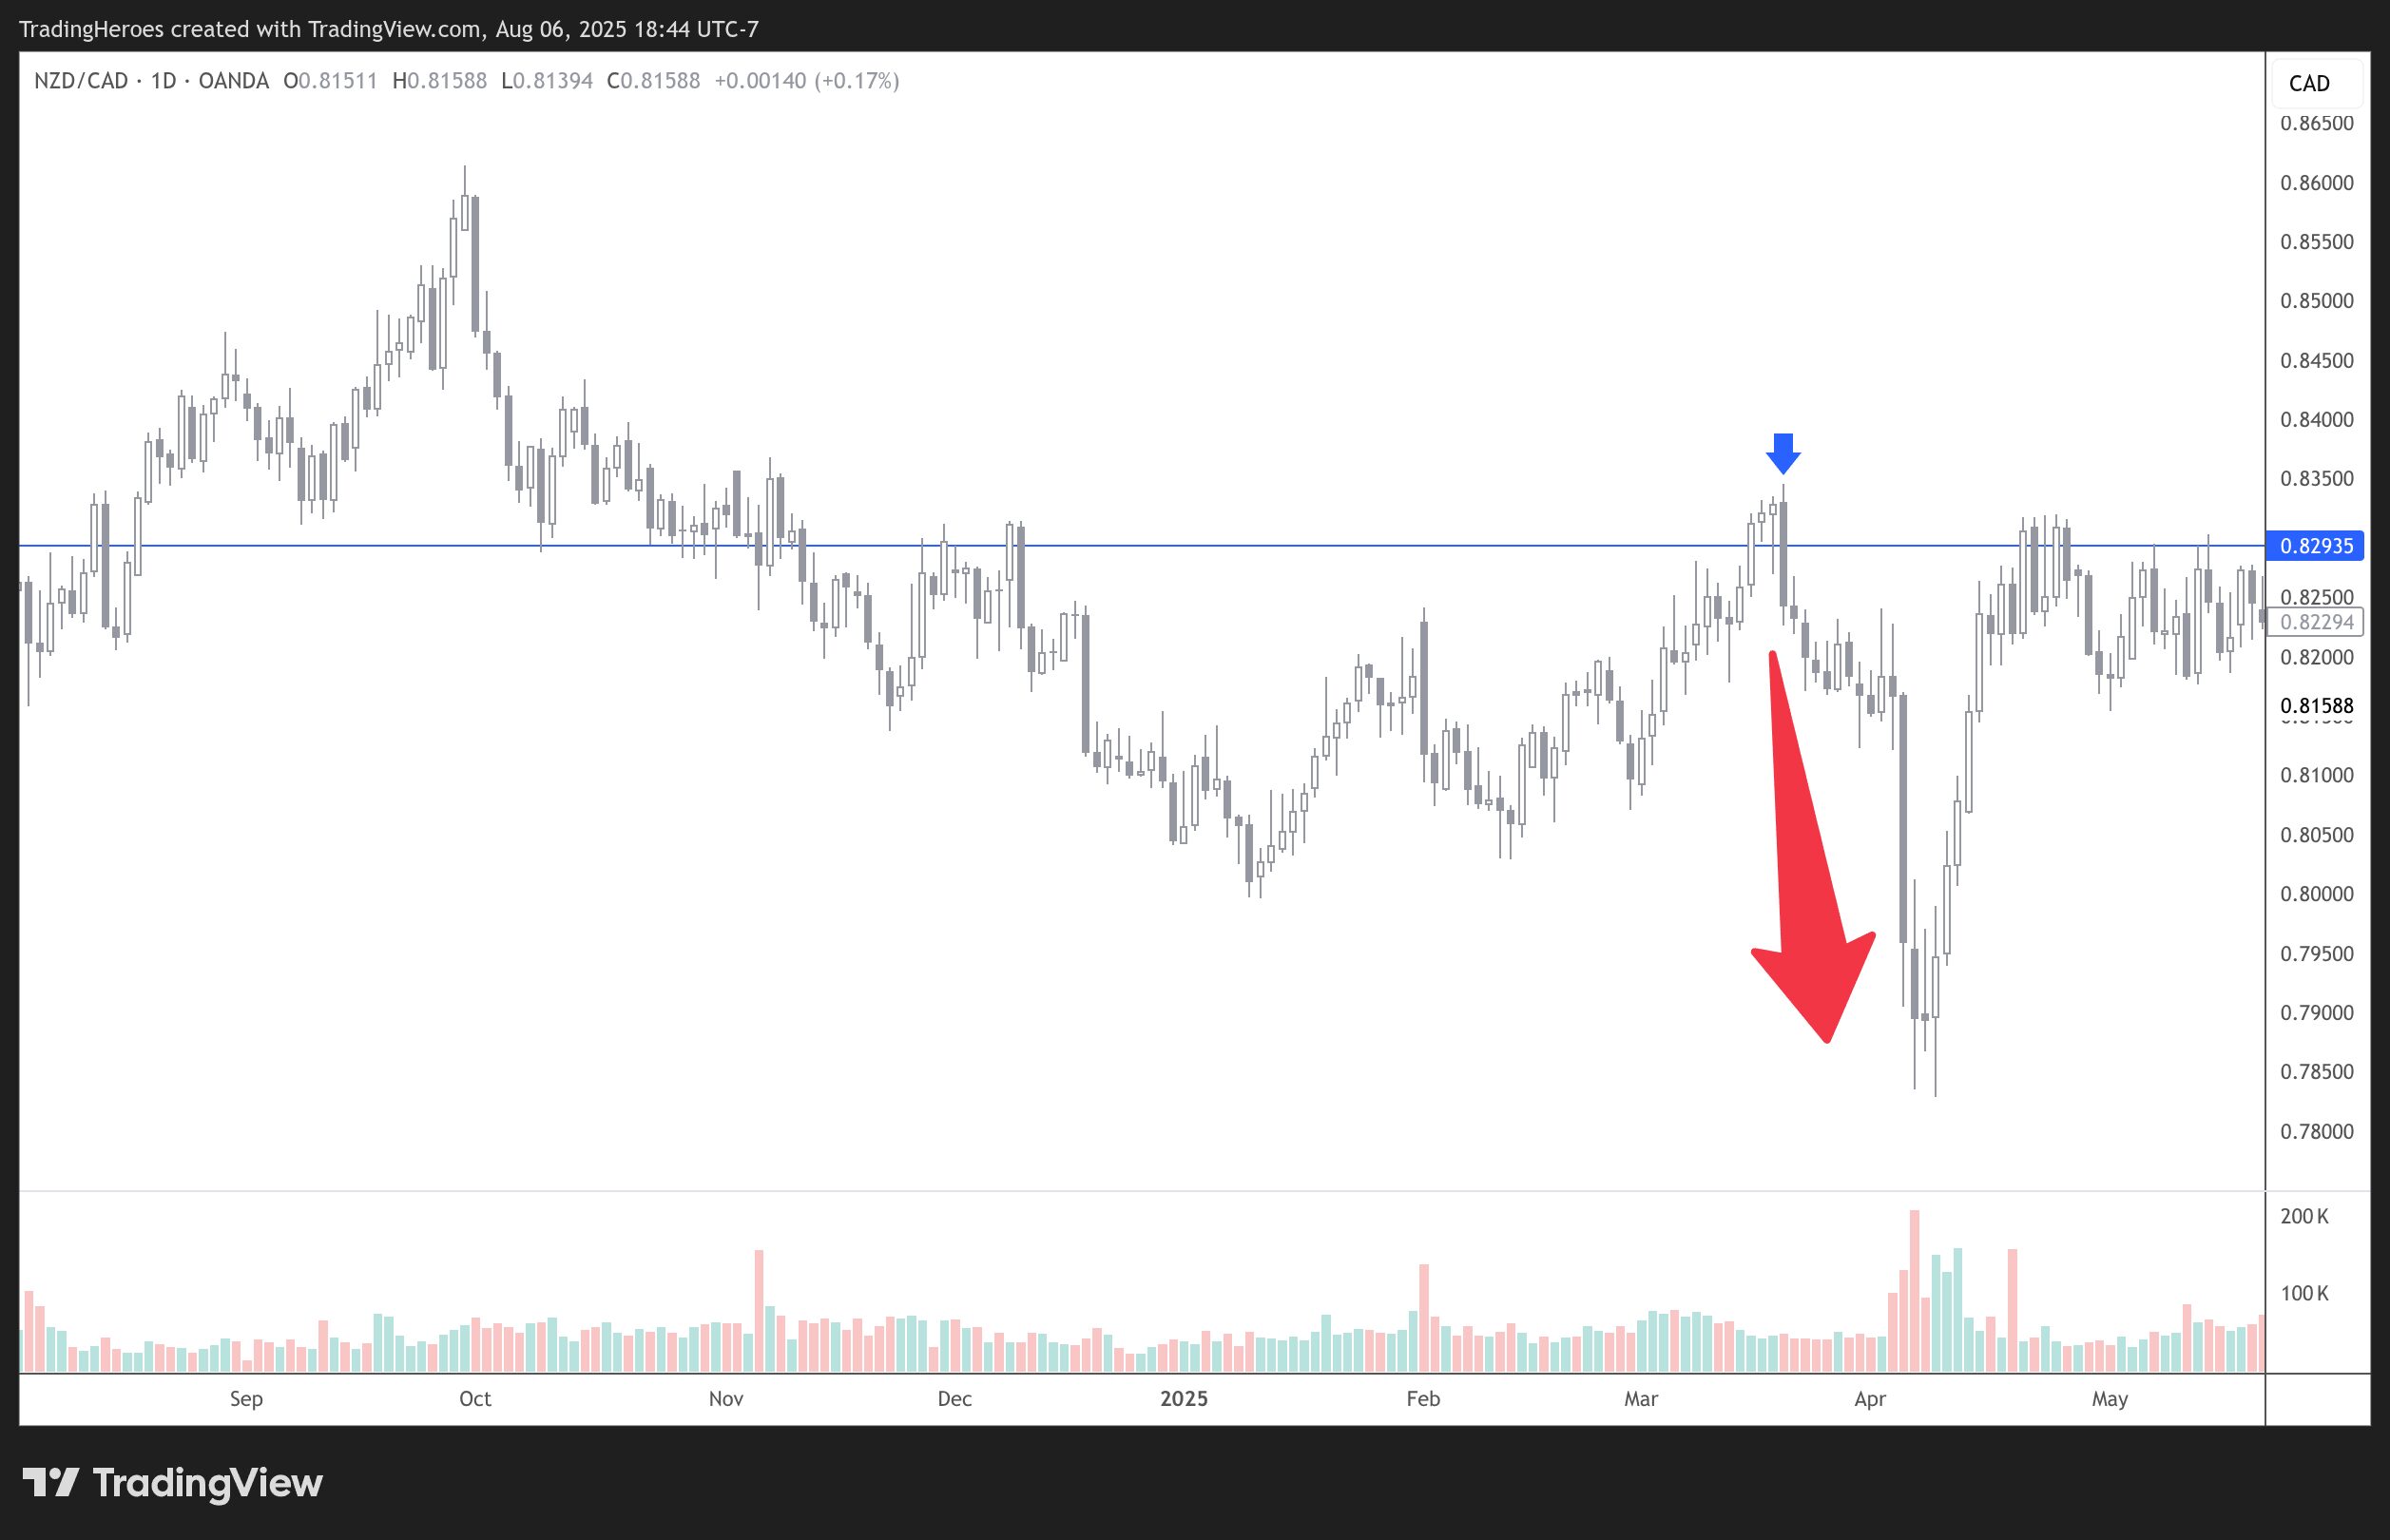
Now here's an example on the NZDCAD chart.
Again there was a sharp move after the engulfing candle prints on the resistance zone.
Take any chart and start looking for this pattern.
You'll notice that it happens more often than you might expect.
But don't stop there.
Be sure to test this pattern out before risking real money.
My Favorite Engulfing Candle Resources
Here are resources for Engulfing Candle trading strategies that I've found super useful.
You can use them to help you create, test and trade Engulfing Candle trading strategies.
- Naked Forex: High-Probability Techniques for Trading Without Indicators – This book teaches a trading strategy called The Big Shadow that uses Engulfing Candles.
- Naked-Markets Backtesting Software – This software will identify Engulfing Candles and can pause the backtest so you can manually enter a trade, or automatically enter a trade that you have an automated entry created. Saves a ton of time when backtesting.
- Engulfing Bar Alert Indicator for MT4 – Get alerts on your screen or mobile app when an Engulfing Candle prints.
- TradingView – Setup alerts for Engulfing Candles by using the built-in indicators.
How to Prove Engulfing Candles Actually Work
At this point, you're probably wondering: Does this actually work?
That's a perfectly natural question and the only one that matters, quite frankly.
So here's the truth about trading Engulfing Candles…
Just like with any other trading method, the success of the chart pattern will be determined by the specific trading plan.
There are many ways to enter and exit trades with this pattern, so you need to define these parameters in order to have a real trading strategy.
I'll provide specific trading strategy plans in the next section.
But here's where most traders get tripped up…
Remember, there are only 2 types of trading strategies, discretionary and fully automated.
Most Engulfing Candle strategies are discretionary.
Therefore, the results can vary greatly between traders.
So it is essential that you backtest it for yourself to find out how good you are at identifying the setups in your trading strategy plan.
Practice can also improve your skills, so don't be afraid to keep running through simulations until you feel you've maxed out your potential.
Now it might be possible to automate an Engulfing Candle strategy. If so, then the results are usually reproducible between traders.
Even then, you still have to create an automated strategy and test it on every market/timeframe you trade.
Always verify, never take another person's word for it.
Remember, profitable trading strategies usually start out as very unprofitable ideas.
So start experimenting and don't be afraid to test your own ideas.
You just might discover something amazing.
Trading Strategies That Use Engulfing Candles
Here are some trading strategies that you can review and start testing for yourself.
I've also included my own backtesting results so you can compare notes and make improvements on these strategies.
- Coming soon
Final Thoughts
This super simple candlestick pattern could be the basis for your next grail trading strategy.
It is easy to identify and can be programmed into most trading platforms.
But it's up to you to test it out and find out if it will work.
Remember, the most profitable strategy in the world is the one that fits YOU best.
Now get to work.