This is a common question that I get and there can be some confusion around it, so I thought that I would write a quick blog post to explain how volume in Forex trading works.
If you have traded stocks before, you probably understand a little bit about how volume can be used to identify potential trades. Since volume is more straightforward in stock trading, I'll use that to illustrate how volume can help traders.

However, if you already understand what volume can show you about trading activity, then skip to the section on How Volume Works in Forex Trading to learn how it applies to FX.
Remember, if you use to choose volume in your trading, it is only a clue as to where price might go. Do not trade off it alone and be sure to backtest your strategy!
What Trading Volume Can Tell Us
Alright, if you don't know anything about volume, then let's take a look at how trading volume in stocks works first, because it is a smaller market and it is easier to explain the concepts. Even though this is not about Forex trading, it will give you a lot of context for the Forex market, later in this post.
So be sure that you understand these concepts first.
Trading volume in stocks is simply a measure of how many shares traded during each candlestick. For example, in this $FCX daily chart, there were 24,157,000 shares (rounded) traded on the most recent day.

This can be a key piece of information in stock trading. But we also need some other information.
How Many Shares are Outstanding?
It is very useful to know the total number of shares that are being publicly traded. This is called the float.
When we check Yahoo Finance, we find that the total float is 1.33 billion shares. In stock trading, this is important because it helps us answer the question:
“How much volume is a lot of volume?”
So in this example, 24 million shares is not a lot of volume, in relation to the 1.33 billion shares that are available to trade.
Now, if there was a day where 600 million shares were traded, then that is almost half the number of total shares, and it would tell us that something very significant is happening with the stock. That brings us to some other trading clues that volume can give us.
Let's take a look at three of the basic ways that volume is used to spot trading opportunities.
Volume Can Show You Exhaustion
When you see higher volume while price is dropping, this shows that investors are dumping the stock and it can be a signal that it is time to sell your shares too.
Without a lot of volume, the price drop could simply be a momentary dip, before it moves up again.
Several big drops, on high volume, could also signal a good opportunity to buy. If you think that a company is solid, but is just the victim of bad short-term news, it could be a great time to buy at a very low price.
In other words, it could signal a bottom.
For example, let's take a look at Citigroup ($C), during the fallout from the financial crisis of 2007. Price was moving down throughout 2008.
Then, towards the beginning of 2009 (points 1 and 2 below), we saw two big spikes in volume, during two down days.

The chart above shows the current split-adjusted price, but at the time, price got down to less than $1, if I remember correctly. I actually bought this stock because the US government basically told everyone that they would not let Citigroup fail.
So that was a fundamental reason for buying the stock.
Now let's look at the volume analysis.
At point #3, there was some buying interest, but price didn't move up significantly.
Buyers step in to buy the stock, for a short-term gain. I was in this group.
However, at point #4, there was another huge spike in selling volume, but price failed to drop significantly. That was a sign that most of the sellers were out of the stock, at that point.
So that is how we can use volume to show us when a stock does not have any more buyers and might be ripe for a purchase.
Volume Can Show You Accumulation
Next, volume can give you hints as to when a stock is being possibly accumulated. This is one example of how we can see volume increasing, while price is basing.
In the basing pattern, there are more green bars than red bars in the volume indicator. So this could be a good hint that price might start to turn around soon.
…and in this well chosen example, it does 😉

Volume Can Show the Strength of a Move
The general idea is that if you see volume increasing in a trend, it is likely that you will continue to see price move in the same direction. It makes sense because as a trend gets going, more people need to pile in, to keep the trend going.
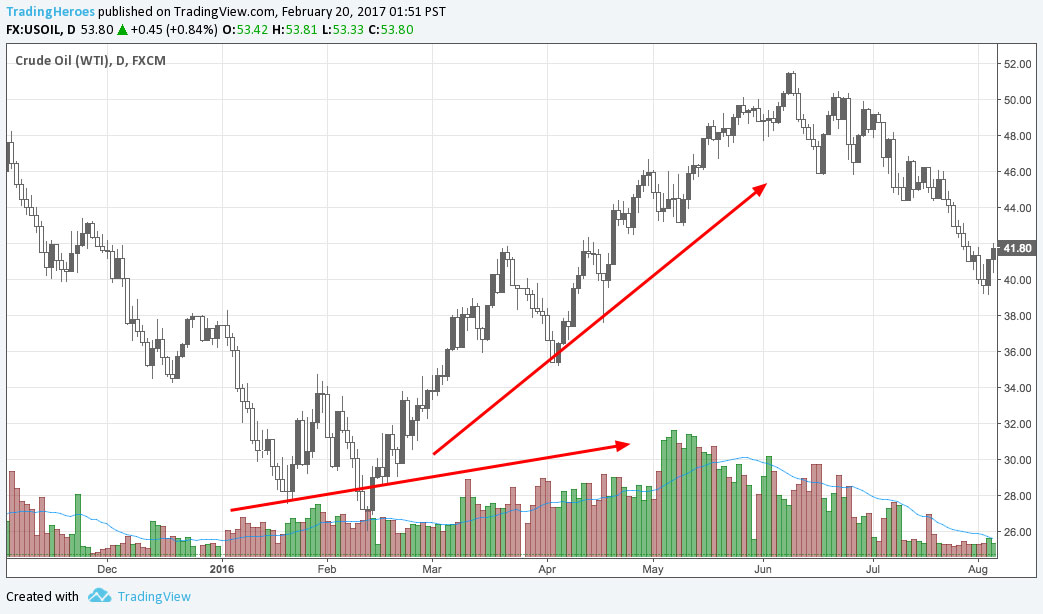
Here is an example of a trend in crude oil where volume increases in an uptrend. Although this is futures and not stocks, the same principle applies. Once volume starts to dry up, the trend reverses, soon after.
Alright, now that you have an idea of how volume can be used in stock trading, let's jump over to Forex trading to see if these same principles apply.
How Volume Works in Forex Trading
After reading the previous examples, you are probably ready to throw up a volume indicator on your FX charts.
Hold on for a minute because volume works a little differently in FX.
For starters, there is no way to figure out how much “float” or how much total currency is traded every day.
This is because Forex trading is a decentralized market.
Since there isn't a primary exchange that all transactions run through, there is no way to count how much currency is being traded at any one time. So what you are seeing on your FX charts is only the volume that your broker sees.
This can lead to some very different numbers, between brokers.
For example, here are two EURUSD screenshots taken at the same time. This chart uses Oanda data and shows that the current volume is 8,156 currency units.

But when we look at an FXCM chart, we see a much different picture. This chart shows a volume of 50,869 currency units.
If you look at the relative volume, the graphs are pretty similar, but they are not exactly the same. For example the right side of this chart shows a big spike. However, on the Oanda chart, there is actually a decline in volume.

Does this mean that volume in Forex trading is useless?
Well, let's take a look at a few example to see if it could useful, even if you are only getting part of the picture. I'll examine some moves in the EURUSD and see if we can find the same patterns that we saw in the stocks.
Exhaustion
I actually had a hard time finding a good example of an exhaustion volume pattern on the EURUSD daily chart.
This was the best that I could do.
As you can see, price moved down on a lot of volume, but stopped short of a previous support point. After this spike in volume, price started to move up.

Accumulation
This is an example of a pretty long downtrend, followed by a basing pattern and an increase in volume. The volume increase could have been a clue that accumulation was taking place. Price shot up, soon afterwards.

Trend Strength
Here is an example that I found of a strong trend being reinforced by volume. As we saw with the oil example above, when volume starts to decrease, price starts to drop.

Lower Timeframes
From those previous FX examples, volume looks like it could be a fairly useful predictor of future price movement. But hang on for a minute, those were a few well-chosen examples.
…and what happens if you use a different time frame?
Like the 4-hour chart, for example?
This is what you will see…

The differences in market open times and volume are reflected in the intraday volume spikes. Of course, this makes it harder to read than intraday stock volume.
However, if you only take the peaks, it could be usable.
Conclusion
So volume might be able to give us some hints about where price is likely to go next.
However, since we are only seeing volume from one broker, it is tough to trust the numbers to give us an accurate picture of how much currency is being traded across the entire market.
If you want to test a trading strategy that includes volume as a trading signal, be sure to use data from the broker that you will be trading with. This is very important.
I don't find volume useful in FX and I don't recommend using it.
There are some periods when volume can signal a possible move, but for the most part, volume is too flat to make any real trading decisions.
But don't take my word for it. Test it and find out for yourself.
Do you disagree? Have you found a way to trade consistently with FX volume from your broker?
Let me know below…
Please I will like us to talk privately on mail so that we can exchange idea further especially on the issue of fx.
Hi Hugh Kimura,
Thank you for the useful article about volumes. I had one more question on this subject. With stocks, it is pretty straight forward that the volume is derived from the amount of stocks that are floating around. However, when we are talking about currency units where is this information based upon? When we look at the EUR/USD pair for example and the volume is 50,000 currency units, does this mean there is 50,000 euro being traded or 50,000 dollar? For me the first answer sounds more logical, but this is a question that I was asking myself and I could not get a definite answer. Hopefully you can give more clarification on this.
—
Kind regards,
Kevin
Hey Kevin,
You’re welcome. If you are buying 50K EURUSD, you are using 50K EUR to buy the equivalent USD. The lot size is the number of units of the base currency, or the currency that is listed first.